
|
MEANS 10,000 NEEDLESS CANCER DEATHS 
|
|
|---|
10,000 PRE-MATURE OR NEEDLESS CANCER DEATHS
WAS CALCULATED
Just how bad is Chemotherapy?
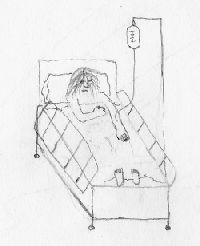
Answer, real BAD, and without Medical Marihuana around to counter-act the weakening affects of chemotherapy, thousands of needless cancer deaths are taking place. I claim 10,000 premature or needless cancer deaths, in America, each and every year.
Now granted because we are relying on probability statistics, this figure is subject to challenge. If you're a (god forbid) radical Libertarian type, your figures will probably be in the tens of thousands, but on the other hand, if you're a narc, or some other kind of anti-Medical marihuana advocate, you will probably be stating NO, that it's only a few hundred needless Cancer deaths. Given the lack of verifiable figures disagreements will be a certainty. But what is not debatable are the basic premises on which my figure is based. Some group or percentage of Cancer victims are dying needlessly, whether it's 1 or 100,000 is irrelevant. I myself leave it up to the reader for herself to determine the exact number of needless or premature deaths. The following is how this museum curator calculated the given figure. For sake of brevity, I've endeavor to keep things as graphical and simple as possible.
Fig 1 - WHAT % OF CANCER VICTIMS SURVIVE, WHAT % DIE?
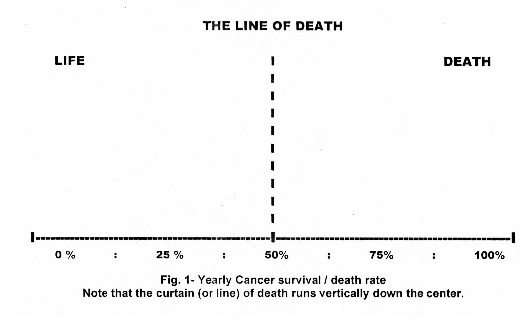
Fig. 1 -- The Line of Death
According to the American Cancer Society, thanks to modern day treatments, Cancer Victims now have a fifty-fifty chance of surviving Cancer. Which by implication means that Cancer Victims also have a 50% chance of NOT surviving Cancer. Graphically, this is represented (Fig. 1) as a vertical line running down the middle, and is known as the curtain or line of death. Note that everything (statistics, probability factors etc.,) located to the left of the line equates to life or Cancer survival, while everything to the right equates to death.
Fig. 2 -- YEARLY NUMBER OF U.S. CANCER DEATHS:
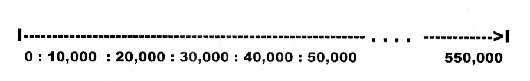
Fig. 2 -- The Total Number of Cancer Deaths
According to the U.S. Federal Government, Cancer kills one out of every four Americans. This figure is also recognized by just about every private anti-Cancer society, including the American Cancer Society etc. In terms of a given number [as 2.2 million Americans die each year], this comes out to a total of about 550,000 Cancer deaths per year. [1] Note that 550,000 is the total number depicted. [MORE]
Fig. 3 -- NUMBERS OF YEARLY CANCER SURVIVAL / DEATHS:
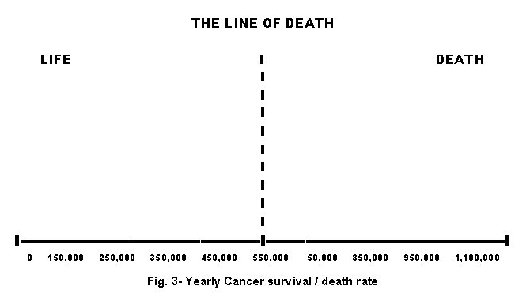
Fig. 3 -- Yearly Number of Cancer Survivors/Deaths
Fig-3, is a combination of figures 1 and 2, depicting the total number of those affected by Chemotherapy (1,100,000). Note that the line of death runs down the very center -- thus statistically speaking 50% (550,000) of all cancer victims are expected to die and 50% to survive. Confused? Let's go back to the factors that were used to create the base:
[1]- According to the American Cancer Society, there is a 50% recovery rate. Meaning that Cancer only kills half of the people affected by the disease each and every year. Taking this factor into account, it creates a statistical base of between 550,000 (those that died) and 1,100,000 (those affected by anti-Cancer therapy).If the second figure is to be believed (and I for one am in no position to question the American Cancer Society), this allows us to start with a statistical base of between 550,000 (those that died) and 1,100,000 (those affected by anti-Cancer therapy).
[2]- This next factor is disputable, but I am of the understanding that: In ALL serious cases of Cancer, chemo-therapy is on the table. And granted, it may not be used, STILL it is on the table.
Fig. 4 - CENTER ADJUSTED - CANCER DEATH RATES:
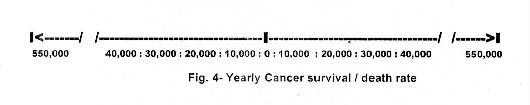
Fig. 4 - Number of Cancer Survival/Death Rates: Center Adjusted:
Fig-4 shows yet another (and probably better) way of depicting the yearly number of U.S. Cancer Deaths verses Survival rates. Notice that everything starts at the center (the zero point) with all Cancer Deaths being grafted to the right and all Survivors grafted toward the left.
FIG. 5 - THE LINE OF DEATH -- CENTER ADJUSTED:
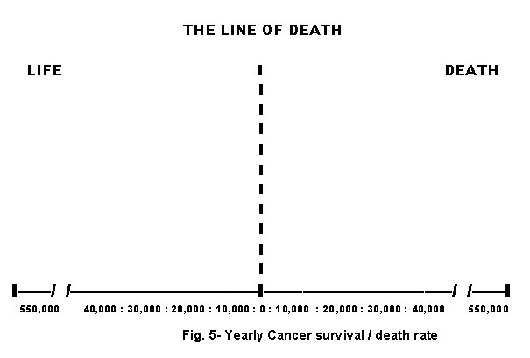
Fig. 5 -- The Line of Death vs: Number of Cancer Deaths:
Fig-5 is very similar to Fig. 3, except that its horizontal baseline has now been replaced with an adjusted centerline (similar to Fig. 4). Thus the "Line of Death" has changed from a mere mathematical place holder to more of a probability statistic. ---- Just pretend that line is on roller skates, moving it to the right or left depicts so many lives saved or lost.
QUESTION: What would happen if the line of death, for whatever reason (say Medical Cannabis was now re-legalized), was moved even a few centimeters to the left?
ANSWER: A lot of peoples lives would be saved.
Now, before going any further, I wish to once again, hammer away, at one of our basic premises. That someone with a better immune system, someone who is better nourished and in general over-all better health, will stand a higher probability of beating any disease [not just cancer, but any illness better] than someone in a weakened condition.
In other words, a Charles Atlas type has a higher chance of surviving an illness than someone just liberated from a Nazi concentration camp. And given the weakening effects that chemotherapy has on the human body, this factor becomes very important. Let us never forget that chemotherapy is nothing more than a poisonous substance that cancer doctors inject into your body. Along with killing cancer cells, it also makes your hair fall out, leads to nausea, vomiting, tremendous weigh loss etc. And all this at a time when a Cancer Victims body is trying to recover from Cancer. Sometimes the side effects of chemotherapy become so bad that Cancer victims have to be taken off the treatment.
ADDING A GAUSSIAN OR BELL SHAPE CURVE:
Taken Human Biological Factors into Account:
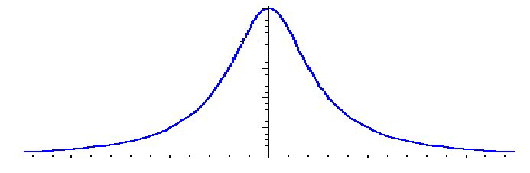
Figure 6 - A typical Gaussian Curve:
So far our graph only takes into account the "Line of Death" in relationship to raw Cancer numbers. However, it is obvious that NOT ALL humans (for various biological reasons) will react the same to the weakening effects of Chemotherapy, nor benefit equally to the use of medicinal Cannabis. Thus, in order to go further we must have a way of taking these various biological factors into account.
Fortunately, I have had the great fortune of frequenting a coffee house close to a major University and as such have had access to PHD type mathematicians. After going over the problem with them and inquiring how best to create a plot, the answer seemed to be universal. Use the GAUSSIAN CURVE; also known as the BELL SHAPE CURVE.
Now, I myself as a former school teacher first became acquainted with the Bell Shape Curve long, long ago as a method of grading. It allocates or dictates that; 10% of the students will given A's, 20% B's, 40% C's, 20% D's and 10% will get F's, etc., figure 6 is pretty much self-explanatory:
However, I never thought of it as also being a biological curve. That is until a physical-Ed teacher told me that even high school sports follow that same curve. He ever went so far as to say that in any given event; let us say a 100-yard sprint, the various times that it takes his students to run it, if graphed, will look exactly like the Bell-Shape Curve.
For those interested in the subject, there are numerous websites devoted to the Gaussian Curve. For here it is enough to say, [and this was told to me over and over again by PHD types], that if given a large number of random and independent events [say like over 1/2 a million people dying of cancer] that it has a good level of scientific accuracy. BUT warning, the key here is that it ONLY works with Independent [meaning none bias], and random factors.
FIG. 7 - THE LINE OF DEATH -- GAUSSIAN BIOLOGICAL FACTOR ADJUSTED:
Fig-7 - Line of death superimposed on a Gaussian Curve:
Fig-7 shows the Line of Death, superimposed on top of a Gaussian Curve, which is needed to adjust for basic Human biological Factors. However, before going any further, it is interesting to note just how well the curve of-and-of-itself describes or allocates Cancer survival factors.
Using our school room example, note that ALL F, D and C (minus) students don't survive or do so well, while ALL C (plus), B and A students survive.
Specifically, the curve also helps explain/graph the answers to some of the following questions:
QUESTION: What is the percentage of Cancer victims for whom Medical Cannabis will NOT be appropriate and should NOT be used? These patients all fall into various categories; but in general their bodies physiologically seem to reject cannabis, and/or for whom, other anti-chemo agents do a better job.SUMMATION:
ANSWER: About 30% or 330,000 yearly cancer patients. This figure comes from statistics [mathematically calculated by the author] from numerous chemotherapy studies done with Marihuana and other agents back in the 1960's and 70's. [2]
QUESTION: What percentage of Cancer Victims would (biologically speaking) find medical benefit in Medical Cannabis? That is to say, for whom Medical Cannabis, would either be equal to or superior in performance to other [I call them alternative] anti-chemo agents?
ANSWER: About 70%. It stand to obvious reason that if Medical Cannabis has no useful effect for 30% of the population, that it therefore would have for the remainder. However, what is that old expression, "The devil is in the details." The chemotherapy / marihuana studies [3] quoted before, and done in the 1960/70's seem to indicate that this figure is only 45%. However (by their own admission) while on paper the chemotherapy patients could have chosen any anti-nausea agent, the structure of the studies deliberately made it a lot harder to physically chose Cannabis as one of the medicines used. In addition to a rigorous screening process, they also (again by their own admission) had problems keeping people in the studies because they started using street Cannabis (assume-ably once they found out about its medical effects -- remember they were done in the late 1960's). Thus this figure really comes from a browse search of our museum's old pharmaceutical journal articles [4] . True, while were not using medical cannabis for chemotherapy treatments back in 1845, still, peoples physiological/biological responses have not changed that much; ---And these figures are solid. Medical Cannabis (as per respectable late 19th, early 20th Century, Medical Journals) exhibited an over 80% positive factor. Thus I can safely state the obvious.
QUESTION: For what percentage of the general population, would Medical Cannabis not only be medically beneficial, but also superior in performance to ALL other alternative treatments.
ANSWER: The answer seems to be around 20%. This figure (like the one above) is based on the old Cancer studies done in the late 1960's, but also seems to be the general response to Cannabis at ALL levels (again, based on old 19th, early 20th Century, Medical Journal articles).
Due to various Human Biological factors:
- For fully 30% of all Cancer victims, Medical Cannabis will NOT be of benefit and thus NOT appropriate.
- However, this also means that for approximately 70% of the population, Medical Cannabis will indeed be of medical benefit. At least equal to or better than other alternative anti-nausea agents.
- Most important of all, for 20% of the general population, Medical Cannabis is not only medically beneficial, but seems to be superior in performance to ALL other alternative treatments.
As an aside, I know that many (especially the Narc's), will take objection to the above figures. And granted, they are my own statistical interpretation of a limited number of old Cancer studies. However, where else are we supposed to obtain our statistics. If the narcotics police question them, than I myself have some questions for them. Why has the American Narcotic Police:
- Effectively outlawed ALL medical research into Medical Cannabis?
- Prevented legitimate institutions (such as Universities) from doing botanical cultivation and research into Cannabis?
- Resorted to out and out censorship, to limit access to government (secret) studies?
WARNING - The above figures ASSUMES that we find ourselves in a First World medical system. God only help you if you live in a third world nation and can't afford to buy "alternative" anti-nausea drugs.
FIG. 8 - THE LINE OF DEATH
ADJUSTED FOR BIOLOGICAL FACTORS:
Fig. 8 - The Line of Death --Adjusted for biological factors:
Fig. 8 - Is a graphical depiction of ALL our previous graphs, but now adjusted for the various Biological Factors summarized previously. Note that our new base; instead of consisting of ALL yearly Cancer Victims (1,100,000), it now only consisted of the (biologically speaking) upper 20% ---the number for which Medical Cannabis would not only be thought of as medically useful, but superior in performance to other (alternative) anti-nausea medications.
Notice however, that of this figure; 50% of them (or 110,000) will recover from cancer anyway -- supposedly without the use of Medical Cannabis.
And so (for our purposes), we are really only interested in that grouping to the right of the "Line of Death." That group (110,000 people) who are dying each and every year. Deaths that we feel may be preventable if the weakening effects of chemotherapy were not so sever.
STATISTICAL POPULATION FACTORS:
But before going any further -- we must first take an aside and look at various physiological/social/legal factors that some claim all effect our case.
Concept - Push me, Pull you:
Using Fig. 8, as our starting point -- Lets pretend that we have a new force that is preventing Cancer victims from using Medical Cannabis. This force will slant our basic cure as shown (Fig. 9A) meaning more will die. On the other hand lets say that a positive pro-Medical Marihuana force is introduced (see Fig. 9B). This means that more will live.
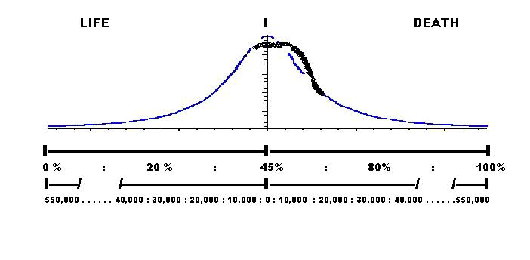
 Fig.-9A - Reflecting a negative (Anti-Medical Cannabis) factor
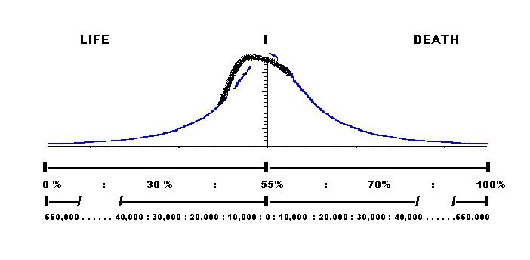
 Fig.-9B - Reflecting a positive (pro-Medical Cannabis) factor
 STATISTICAL POPULATION FACTORS:
Now lets look at one or two of these factors:
ADJUSTMENT: The number/percentage of those who for psychological factors [even if legal] will NEVER make use of Medical Marihuana, simply because of social stigma attached. ANSWER: The answer seems to be 10%, and is bases on cancer studies [5] done with Marihuana back in the early 1960/70's. However, this figure can be marginalized in the future as the sigma factor goes away.
ADJUSTMENT: The number/percentage of those who [because of fear of the law] will NOT use Medical Marihuana at this time, BUT will be more than willing to do so IF LEGAL. ANSWER: Due to our present-day legal system, this figure is hard to come by [but please don't laugh, in Oklahoma an individual was sentenced to a 93-years prison sentence for Medical Marihuana], however, as polls show that over 70 percent of American people support doctor prescribed Marihuana, I assume that this percentage would be quite high. Especially after the stigma factor is done away with.
ADJUSTMENT: The number/percentage of those who at present refuse to undergo Chemotherapy [specifically because of the wasting away effects] and would NOT do so even if Medical Cannabis was an option; AND DIED as a result.
ANSWER: Obviously the actual figure is unknown. But it can safely be assumed that the it is counteracted by the next (below) adjustment factor.
ADJUSTMENT: The number/percentage of those who at present refuse to undergo Chemotherapy [specifically because of the wasting away effects] but would do so IF Medical Cannabis was an option; AND survive cancers specifically as a result. ANSWER: Again, for obvious reasons the actual figure is unknown, BUT (I am of the opinion) that the value is in effect, counter-acted or null-and-void by the adjustment factor above. Thus no statistical changes are needed.
ADJUSTMENT: The number/percentage of those who [Legally or illegally] make used of Medical Cannabis today, BUT still died anyway.
ANSWER: Hopefully the answer is everyone, but more realistically speaking there are a lot of people who for whatever reason are very, very much in fear of the Drug Police, or are simply unaware of its medical actions. However, in either case, I feel that this figure is counter-acted by the below adjustment fact.
ADJUSTMENT: The number/percentage of those who [Legally or Illegally] make used of Medical Cannabis today, AND lived solely because of that fact.ANSWER: Due to our present legal system, nether of these group (nor the one above) can be accurately accounted for and at best can only be guessed at. However, I am of the opinion that this adjustment factor is also statistically counter-act or null and void-and-void by the one just above.
All Right, one could go on and on with the Social/Statistical factors, that most assuredly affect our curve. But I think the reader is already catching on. The point being made is this, that for every downside, social/legal/populational factor imaginable it seems that there is a counter factor that returns the curve back to its starting point.
Or IN OTHER WORDS, is seems that ALL the Social/Statistical/Legal/populational factors tend to counter act one another, thus (in the overall scheme of things) can be ignored.
FINAL CONCLUSION / FINAL MATH:
All right, before going into our final calculations, let's go over what has already been established.
- First that Social-Legal-Populational factors may safely be ignored because they essentially Cancel each other out.
- That 550,000 Americans, each and every year, die of Cancer and an equal number are effected by the Chemotherapy decisions. Total 1,100,000 people.
- That while Medical Cannabis, CAN AND DOES counter-act the wasting away effects of chemotherapy, AND has been shown to be superior in performance, due to human biological reasons, IT IS NOT FOR EVERYONE, and for some percentage of the population, it won't even work.
- However (again due to human biological differences) for approximately 20% of the population, Medical Cannabis not only acts to counteract the weakening effects of chemotherapy, BUT is superior than ALL other (alternative) Drugs meant for this purpose. AND for some percentage of the population, NOTHING ELSE will work, it's either Medical Cannabis or NOTHING. [For our calculations, counting only those who die, this figure is 110,000 ]
-
QUESTION: What percent of all cancer patients suffer serious (big time) chemotherapy setbacks.
ANSWER: According to statistics provided by the NCI (National Cancer Institute), as well as articles in modern day medical journals that figure is about 20 percent.
Of this figure, again using a Bell-shape or Gaussian Curve (not shown) and taking only the A, B and C+ students, we obtain our final figure of approximately 10,000.
Granted, the figures are subject to challenge, BUT what is indisputable is that SOME number of present day Cancer Patents are Dying either prematurely or needlessly.
FOOTNOTES:
[1]- The figure is generated from ongoing counts or county morgue death certificates. However, I for one have my doubts. Take a look at [John Baca's Death Certificate], I deify anyone to tell me what he actually died of. The problem is that Doctors (who fill out the paper work) have a tendency of keeping things short, too short and not putting down ALL the conditions that actually led to the death, only the actual (last minute) cause. Thus, many cancer deaths are written up as "Respiratory Failures," etc. In other words, the figure is tabulated from death certificates, but a lot of guess work goes into it. However, this is not the place to go into the subject it's enough to say that I believe that the actual figure is much higher. Proof: Just look at the obituaries of any Sunday newspaper and take note the percentage of Cancer deaths etc. [Sub-note:] Moses Baca - To those of you NOT in the know, Moses Baca was one of the first two persons arrested under the newly passed anti-Marihuana Tax Act of 1937. We use his death certificate solely to prove a point -- Does anyone know what he died of? What exactly is Massive toxemia? I don't know and nether does anyone else.
[2]- Originally summaries of these studies could be found at http://:www.lindesmith.org - Also they are located elsewhere in this section.
[3]- ibid
[4]- Note, our museum has collected hundreds of old Cannabis Medical Journal articles. Feel free to ask for an updated index, also ALL articles have been scanned unto CD-Rom format.
[5]- See footnote #3
WANT TO KNOW MORE:
=====================
Due to space / download time considerations, only selected materials are displayed. If you would like to obtain more information, feel free to contact the museum. All our material is available (at cost) on CD-Rom format.
CONTACT PAGE
 Statiscial Problems |
 BACK TO MAIN SECTION |
 Cancer Studies |