
|
FDA GRANDFATHER Clause Petition |
|
|---|
EVIDENCE THAT MEDICAL CANNABIS
WAS IN USE AFTER June 25, 1938
According to the, ‘Annual Report of the Secretary of the Treasury’ :
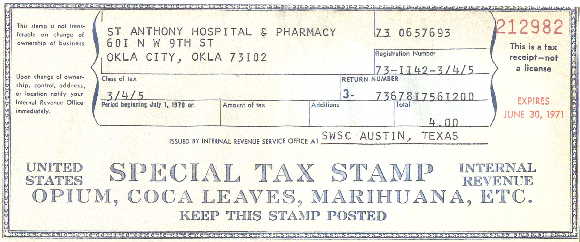
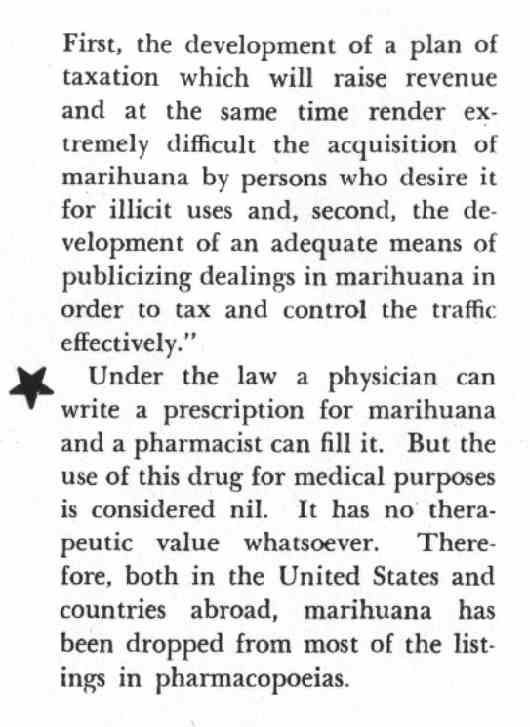
“The enforcement of the taxing features of the Marihuana Tax Act of 1937, approved August 2, 1937, will have the effect of restricting the use of the drug to industrial, medical, and scientific purposes; and the publicizing of dealings in marihuana will prevent distribution for the purpose of maintaining or increasing narcotic addiction. Under the provisions of the act legitimate handlers of marihuana are required to pay occupational taxes, to register with the collector of internal revenue, and to file information returns. All transfers of the drug must be made in pursuance of special order forms issued by the Secretary of the Treasury, and a tax is imposed upon each transfer. A tax of $1 an ounce is imposed upon transfers to registered persons, and $100 an ounce upon transfers to nonregistered persons. Heavy penalties are provided for violations of the provisions of the act. “There was also a federal charge to register:
- Doctors, Veterinarians --- $1 per year
- Pharmacists, wholesalers, dealers --- $3 per year
- Growers --- $1 per year
- Manufacturers -- $24 per year
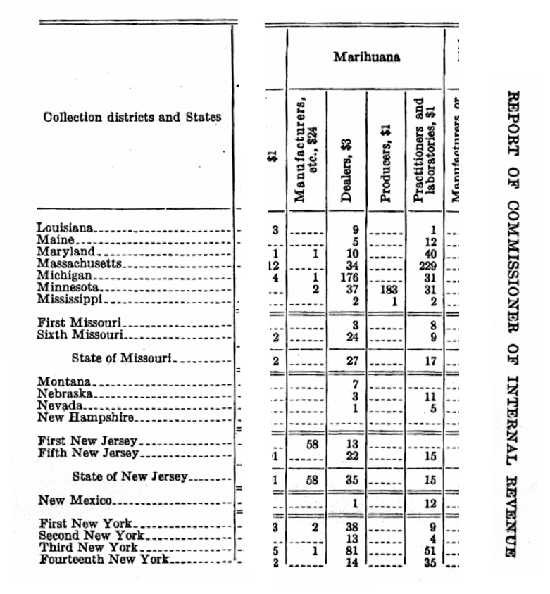
Statistical tables representing each of the four different forms of registrations [broken down by State] were published yearly in the “Annual Report of the Commissioner of Internal Revenue;” which appeared as follows:
Of The Commissioner Of Internal Revenue (IRS)
| STATE | 1938 | 1939 | 1940 | 1941 | 1942 | 1943 | 1944 | 1945 | 1946 | 1947 | 1948 | 1949 | 1950 | 1951 |
| Alabama | 26 | 10 | 8 | 4 | 4 | 3 | 3 | 2 | 2 | 2 | 2 | 2 | 1 | 1 |
| Arizona | 2 | 2 | 1 | - | - | - | - | - | - | - | - | - | - | - |
| Arkansas | 9 | 3 | 3 | 3 | 3 | 4 | 1 | 1 | 1 | 1 | 1 | 1 | 1 | 1 |
| California | 67 | 39 | 16 | 12 | 9 | 6 | 7 | 6 | 9 | 6 | 4 | 3 | 3 | 2 |
| Colorado | 17 | 13 | 11 | 9 | 9 | 8 | 5 | 5 | 5 | 4 | 4 | 3 | 3 | 2 |
| Connecticut | 2 | - | - | - | - | - | - | - | - | - | - | - | - | - |
| DC | 4 | 1 | 1 | 1 | 1 | 1 | 1 | 1 | 2 | 1 | 1 | 1 | 1 | na |
| Florida | 39 | - | - | - | - | - | - | - | - | - | - | - | - | - |
| Georgia | 122 | 29 | 14 | 6 | 3 | 3 | 2 | 3 | 1 | 1 | 1 | - | - | - |
| Illinois | 45 | 30 | 26 | 19 | 19 | 23 | 18 | 16 | 13 | 10 | 9 | 10 | 8 | 6 |
| Indiana | 17 | 7 | 8 | 3 | 3 | 6 | 4 | 3 | 3 | 3 | 2 | 1 | - | - |
| Iowa | 8 | 3 | 2 | - | 1 | 3 | 13 | 1 | 1 | - | - | - | - | - |
| Kansas | 12 | 6 | 6 | 2 | - | - | - | - | - | - | - | - | - | - |
| Kentucky | 67 | 19 | 25 | 14 | 20 | 35 | 31 | 14 | 6 | 8 | 8 | 4 | 6 | 6 |
| Louisiana | 9 | 2 | 2 | 2 | 2 | 2 | 2 | 2 | 1 | - | 1 | - | 1 | 1 |
| Maine | 5 | 2 | 1 | 1 | 1 | 1 | 1 | 1 | - | - | - | - | - | - |
| Maryland | 10 | 9 | 7 | 5 | 4 | 2 | 3 | 3 | 1 | 1 | 1 | 1 | 1 | 2 |
| Mass. | 34 | 12 | 5 | 3 | 2 | 2 | 2 | 2 | 2 | 2 | - | - | - | - |
| Michigan | 176 | 72 | 17 | 10 | 8 | 6 | 5 | 5 | 4 | 4 | 4 | - | 5 | 2 |
| Minnesota | 37 | 20 | 15 | 9 | 10 | 8 | 8 | 8 | 7 | 5 | 5 | 5 | 4 | 2 |
| Mississippi | 2 | 2 | - | - | - | - | - | - | - | - | - | - | - | - |
| Missouri | 27 | 9 | 8 | 6 | 4 | 3 | 3 | 3 | 2 | 2 | 1 | 2 | 2 | 1 |
| Montana | 7 | 7 | 3 | 1 | - | - | - | - | - | - | - | - | - | - |
| Nebraska | 3 | 5 | 4 | 7 | 5 | 5 | 5 | 4 | 4 | 4 | 4 | 3 | 4 | 4 |
| Nevada | 1 | 1 | - | - | - | - | - | - | - | - | - | - | - | - |
| New Jersey | 35 | 33 | 20 | 16 | 17 | 15 | 15 | 12 | 14 | 14 | 11 | 7 | 6 | 5 |
| New Mexico | 1 | 1 | - | - | - | - | - | - | - | - | - | - | - | - |
| New York | 340 | 121 | 101 | 48 | 50 | 29 | 34 | 28 | 27 | 23 | 19 | 19 | 14 | 12 |
| N. Dakota | 4 | 1 | - | - | - | - | - | - | - | - | - | - | - | - |
| Ohio | 95 | 29 | 17 | 23 | 8 | 4 | 4 | 5 | 5 | 3 | 3 | 3 | 3 | 3 |
| Oklahoma | 4 | 4 | 3 | 3 | 3 | 2 | 1 | 1 | 3 | 1 | 1 | 1 | - | 1 |
| Oregon | 28 | 17 | 9 | 7 | 6 | 3 | 3 | 3 | 3 | 4 | 4 | 4 | 1 | 1 |
| PA. | 150 | 73 | 49 | 28 | 27 | 19 | 21 | 16 | 15 | 11 | 11 | 10 | 9 | 8 |
| RhodeIsland | 5 | 2 | 3 | 2 | 1 | 2 | 2 | 2 | 2 | 2 | 2 | 2 | 2 | 2 |
| S Carolina | 44 | 14 | 12 | 5 | 3 | 3 | 1 | 1 | 1 | 1 | 1 | 1 | - | 1 |
| S.Dakota | 1 | 1 | 1 | 1 | - | - | - | - | - | - | - | - | - | - |
| Tennessee | 55 | 21 | 5 | 4 | 1 | 2 | 1 | 1 | 1 | 1 | 1 | 1 | - | - |
| Texas | 18 | 10 | 11 | 9 | 7 | 16 | 7 | 3 | 3 | 3 | 2 | 2 | 1 | 2 |
| Utah | 6 | 3 | 3 | 5 | 2 | 2 | 2 | - | 1 | - | 1 | - | - | - |
| Virginia | 17 | 6 | 4 | 3 | 3 | 2 | 2 | - | - | - | - | - | - | - |
| Washington | 21 | 9 | 7 | 6 | 5 | 5 | 1 | - | - | - | - | - | - | - |
| W.Virginia | 25 | 9 | 3 | 1 | 2 | 1 | 1 | 1 | 1 | 1 | 1 | 1 | 1 | - |
| Wisconsin | 8 | 6 | 3 | 4 | 3 | 3 | 3 | 5 | 6 | 5 | 4 | 7 | 4 | 4 |
| Wyoming | 6 | 3 | 3 | 2 | 2 | 1 | 1 | 1 | 2 | 1 | 1 | 1 | 1 | - |
| STATE | 1938 | 1939 | 1940 | 1941 | 1942 | 1943 | 1944 | 1945 | 1946 | 1947 | 1948 | 1949 | 1950 | 1951 |
| Alabama | 33 | 15 | 7 | 5 | 2 | 2 | 2 | 1 | 1 | 2 | 1 | 1 | 1 | 1 |
| Arizona | 2 | 2 | 1 | 1 | - | - | - | - | - | - | - | - | - | - |
| Arkansas | 27 | 12 | 12 | 5 | 7 | 4 | 4 | 3 | 2 | 2 | 2 | 2 | 2 | 2 |
| California | 110 | 98 | 75 | 61 | 61 | 43 | 35 | 39 | 33 | 29 | 48 | 29 | 29 | 28 |
| Colorado | 36 | 32 | 21 | 14 | 13 | 12 | 5 | 5 | 4 | 4 | 4 | 3 | 6 | 10 |
| Connecticut | 3 | - | 1 | - | 2 | - | 3 | 3 | 2 | 2 | 3 | 4 | - | 5 |
| Delaware | 1 | 1 | 1 | 1 | 1 | - | 1 | 1 | 1 | 1 | 1 | 2 | 2 | 3 |
| DC | 13 | 14 | 11 | 10 | 9 | 10 | 10 | 8 | 8 | 9 | 7 | 6 | 6 | na |
| Florida | 9 | - | - | - | - | - | - | - | - | - | - | - | - | - |
| Georgia | 141 | 60 | 34 | 27 | 16 | 16 | 19 | 11 | 8 | 9 | 8 | 8 | 7 | 7 |
| Hawaii | 5 | 4 | 4 | 3 | 3 | 3 | 3 | 3 | 3 | 3 | 3 | 3 | 3 | 2 |
| Idaho | - | - | 1 | - | - | - | - | - | - | - | - | - | - | - |
| Illinois | 54 | 57 | 47 | 40 | 37 | 36 | 29 | 25 | 22 | 17 | 20 | 20 | 24 | 18 |
| Indiana | 242 | 144 | 96 | 64 | 48 | 40 | 29 | 25 | 25 | 23 | 15 | 9 | 7 | 8 |
| Iowa | 69 | - | 23 | 19 | 12 | 12 | 14 | 9 | 11 | 9 | 6 | 10 | 12 | 10 |
| Kansas | 17 | 15 | 12 | 8 | 1 | 1 | 1 | 1 | 1 | 1 | 1 | 1 | 1 | - |
| Kentucky | 102 | 56 | 37 | 24 | 18 | 19 | 10 | 9 | 9 | 9 | 7 | 7 | 7 | 2 |
| Louisiana | 1 | 2 | 2 | 2 | 2 | 2 | 1 | 2 | 1 | 1 | 1 | 1 | 1 | 1 |
| Maine | 12 | 9 | 7 | 7 | - | 5 | 4 | 3 | 1 | 1 | 1 | - | - | - |
| Maryland | 40 | 28 | 20 | 18 | 20 | 15 | 14 | 12 | 13 | 10 | 9 | 8 | 10 | 10 |
| Mass. | 229 | 144 | 111 | 92 | 74 | 63 | 54 | 42 | 40 | 35 | 28 | 26 | 23 | 22 |
| Michigan | 31 | 27 | 29 | 22 | 14 | 10 | 9 | 11 | 8 | 7 | 6 | 5 | 3 | 3 |
| Minnesota | 31 | 21 | 18 | 14 | 13 | 8 | 9 | 9 | 6 | 6 | - | 5 | 3 | 2 |
| Mississippi | 2 | - | - | - | - | - | - | - | - | - | - | - | - | - |
| Missouri | 17 | 24 | 11 | 10 | 13 | 9 | 8 | 7 | 6 | 6 | 6 | 5 | 4 | 2 |
| Montana | - | - | - | - | 1 | 1 | - | - | - | - | - | - | - | - |
| Nebraska | 11 | 27 | 24 | 48 | 38 | 35 | 43 | 36 | 89 | 34 | 37 | 34 | 33 | 32 |
| Nevada | 5 | 2 | 2 | 2 | 2 | 2 | - | - | - | - | - | - | - | - |
| New Jersey | 15 | 32 | 27 | 26 | 24 | 32 | 17 | 16 | 18 | 16 | 15 | 15 | 15 | 14 |
| New Mexico | 12 | 8 | 4 | - | - | - | - | - | - | - | - | - | - | - |
| New York | 433 | 239 | 197 | 93 | 148 | 95 | 88 | 64 | 63 | 69 | 64 | 54 | 48 | 36 |
| N. Carolina | 1 | 2 | 1 | 1 | 1 | 1 | - | - | - | - | - | - | - | - |
| N. Dakota | 3 | 5 | 5 | 5 | 2 | 2 | 2 | 2 | - | - | - | - | - | - |
| Ohio | 257 | 194 | 121 | 77 | 73 | 60 | 40 | 39 | 37 | 25 | 29 | 26 | 24 | 19 |
| Oklahoma | 4 | 2 | 3 | 3 | 2 | 2 | 2 | 2 | - | 1 | 1 | 1 | 2 | 1 |
| Oregon | 16 | 21 | 15 | 13 | 7 | 3 | 5 | 5 | 5 | 6 | 2 | 3 | 3 | 2 |
| PA. | 198 | 153 | 114 | 87 | 73 | 62 | 61 | 44 | 48 | 41 | 37 | 39 | 38 | 37 |
| RhodeIsland | 3 | 3 | 2 | 2 | - | 1 | 1 | - | - | - | - | - | 1 | - |
| S Carolina | 50 | 28 | 14 | 9 | 5 | - | 6 | 5 | 5 | 5 | 6 | 5 | 6 | 6 |
| S Dakota | 2 | 2 | 2 | 1 | 1 | - | - | 1 | 1 | - | - | - | - | - |
| Tennessee | 60 | 34 | 23 | 20 | 14 | 8 | 5 | 3 | 3 | 3 | 3 | 2 | 1 | - |
| Texas | 24 | 13 | 12 | 9 | 8 | 8 | 7 | 10 | 7 | 7 | 6 | 5 | 3 | 5 |
| Utah | 2 | - | 2 | 4 | 1 | 2 | 2 | - | - | - | - | - | - | - |
| Vermont | 6 | 4 | 3 | 1 | - | - | - | - | - | - | - | - | - | - |
| Virginia | 22 | 19 | 16 | 12 | 12 | 11 | 5 | 4 | - | 3 | 3 | 3 | 2 | 2 |
| Washington | 38 | 32 | 26 | 20 | 16 | 15 | 11 | 8 | 8 | 7 | 6 | 5 | 4 | 4 |
| W.Virginia | 23 | 16 | 9 | 7 | 7 | 5 | 6 | 7 | 4 | 1 | 1 | 3 | 1 | 1 |
| Wisconsin | 6 | 7 | 4 | 3 | 3 | 1 | 2 | 4 | 2 | 1 | 2 | 2 | 2 | 2 |
| Wyoming | 17 | 13 | 11 | - | - | 5 | 5 | 3 | 2 | 2 | 2 | 2 | 2 | 2 |
| STATE | 1938 | 1939 | 1940 | 1941 | 1942 | 1943 | 1944 | 1945 | 1946 | 1947 | 1948 | 1949 | 1950 | 1951 |
| Calif. | 8 | 5 | 3 | 3 | 2 | - | 1 | 1 | - | 1 | 1 | - | - | - |
| Illinois | 1 | 3 | 2 | 2 | 2 | 1 | 2 | 2 | 1 | 1 | 1 | 1 | 1 | - |
| Kentucky | 1 | - | - | - | - | - | - | - | - | - | - | - | - | - |
| Maryland | 1 | 2 | 2 | 2 | 2 | - | 1 | - | - | - | - | - | - | - |
| Michigan | 1 | - | - | - | - | - | - | - | - | - | - | - | - | - |
| Minnesota | 2 | - | - | - | - | - | - | - | - | - | - | - | - | - |
| Nebraska | - | - | - | - | - | - | - | - | 1 | 1 | 1 | 1 | 1 | 1 |
| New Jersey | 58 | - | - | - | - | - | - | - | - | - | - | - | - | - |
| New York | 3 | 7 | 6 | 7 | 6 | 4 | 5 | 3 | 4 | 5 | 7 | 9 | 5 | 3 |
| Ohio | 1 | 1 | 1 | 1 | 1 | 1 | 1 | 2 | - | - | - | - | - | - |
| PA. | 2 | 3 | 1 | 1 | 1 | 1 | 1 | 1 | 1 | 1 | 1 | 1 | 1 | 1 |
| S Carolina | - | - | - | - | - | 1 | - | - | - | - | - | - | - | - |
| Wisconsin | 1 | - | - | - | - | - | - | - | - | - | - | - | 1 | 1 |
| STATE | 1938 | 1939 | 1940 | 1941 | 1942 | 1943 | 1944 | 1945 | 1946 | 1947 | 1948 | 1949 | 1950 | 1951 |
| Alabama | - | - | - | 1 | 2 | 1 | 1 | - | - | - | - | - | - | - |
| Calif. | - | - | - | - | - | - | - | - | 1 | - | - | - | 1 | - |
| Colorado | - | - | - | - | - | - | 2 | 2 | - | - | - | - | - | - |
| Delaware | - | - | - | - | - | - | - | - | - | - | - | 1 | 1 | - |
| Illinois | - | 1 | 2 | - | 1 | 3272 | 3331 | 934 | - | 1 | 1 | - | - | - |
| Indiana | - | - | 1 | 1 | - | 844 | 845 | - | - | - | - | - | - | - |
| Iowa | 2 | - | - | 2 | - | 4073 | 4083 | 986 | 1 | 1 | 1 | 1 | - | - |
| Kentucky | 154 | 36 | 108 | 321 | 8308 | 9200 | 15178 | 130 | 84 | 130 | 145 | 40 | 36 | 22 |
| Louisiana | - | - | - | 1 | 1 | 1 | 1 | 1 | - | - | - | - | - | - |
| Mass. | - | - | - | - | - | - | 2 | - | - | - | - | 3 | - | - |
| Michigan | - | - | - | - | - | - | - | - | - | - | - | 3 | - | - |
| Minnesota | 183 | - | - | - | 107 | 3619 | 3745 | 808 | 4 | 5 | - | - | - | - |
| Miss. | 1 | 1 | - | - | 2 | 1 | - | - | - | - | - | - | - | - |
| Missouri | - | - | - | 1 | 3 | - | 2 | - | - | - | - | - | - | 1 |
| Montana | - | - | 1 | 1 | - | - | - | - | - | - | - | - | - | - |
| Nebraska | - | - | - | - | - | - | - | - | 1 | 1 | 1 | 1 | 1 | 1 |
| Nevada | - | - | - | - | - | - | 1 | - | - | - | - | - | - | - |
| New York | - | - | - | 29 | - | 3 | 15 | 17 | 1 | 5 | 2 | - | - | 3 |
| N. Dakota | 2 | - | - | - | - | - | - | - | - | - | - | - | - | - |
| Ohio | - | - | - | - | 2 | 3 | - | - | - | 6 | - | - | - | - |
| S Carolina | - | - | - | - | 3 | 5 | 1 | - | - | - | - | - | - | - |
| Tennessee | - | - | - | - | 18 | 80 | 76 | - | - | - | - | - | - | 1 |
| Utah | - | - | - | - | - | - | - | - | - | 1 | - | - | - | - |
| Virginia | - | - | - | - | 2 | 1 | 1 | 1 | - | - | - | - | - | - |
| W.Virginia | - | - | - | - | - | - | - | - | - | 1 | 1 | - | - | - |
| Wisconsin | 111 | 191 | 171 | 400 | 600 | 3451 | 3676 | 1849 | 706 | 531 | 465 | 410 | 347 | 110 |
| Wyoming | - | - | - | 9 | 7 | - | - | - | - | - | - | - | - | - |
NOTE: Every effort has been made to track-down specifics, such as which pharmaceutical companies paid which tax etc., however, try as we might,[B] this museum has not been able to obtain such records. However we can still treat these statistics as proof that the stated activities were indeed taking place.
TRUE some of these statistics represent Industrial Hemp verses Medical uses, especially during the Second World War, when America even had its own Hemp Czar. Still one would be had pressed to explain WHY a medical Doctor would want to pay the M.T.A. for any other than medical purposes. Proof we feel that Medical Cannabis was indeed in medical use long after June 25, 1938.

WARNING: During transcription, from archival book to actual web-code, numerous transcriber errors were located and corrected, but no doubt it is still possible that one or two digits may be in error. However, such errors are irreverent. The petitioner (more by accident than by design) has noticed that the original data of-and -by itself contains numerous mathematical and other obvious errors. Examples of which include, tables that don’t tabulate as shown in the originals, data that is obviously incorrect (example: Ohio lists only one drug manufacturer when we know for a fact that there were at least two at the time), etc. But most damning of all is the fact that this data -- obtained from the “‘Annual Report of the Secretary of the Treasury’ does not match the data given by other government publications such as the ‘Annual Report of the Secretary of the Treasury,’ or that provided by the narc’s at the time. However, while the exact figures vary from one Government agency to the next, they are Official and are the best ones available.
FOOTNOTES:
[A]- These years 1939-1951, were selected solely because they were available via a local public library.
[B]- For whatever reason (although contacted and asked) the various government agencies involved do not seem to be very cooperative on the subject. Believe me, we have tried.
* States not listed indicate no activity.
WANT TO KNOW MORE:
=====================
Due to space / download time considerations, only selected materials are displayed. If you would like to obtain more information, feel free to contact the museum. All our material is available (at cost) on CD-Rom format.
CONTACT PAGE
FDA PETITION Back to the Previous Addendum |
 BACK TO PETITION INDEX |
FDA PETITION  On to the Next Addendum |